Spreadsheet Software
Week 3 Spreadsheet Assignment - Part 1
Spreadsheet software can be a very powerful tool in the classroom. Not only can spreadsheet software help teachers with various administrative functions, it can also be a tool used in instruction. Spreadsheets can be used to perform calculations, create databases, organize information, create charts and graphs, create art, create graphic organizers, and many other useful functions. Below are four examples of spreadsheets and how they can be used in a classroom setting
http://www.forsythcountyschools.org/its/kadkins/timeline.htm
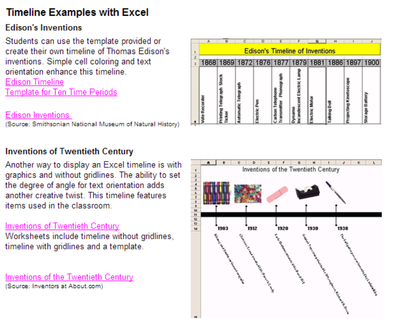
This lesson uses spreadsheets to make a timeline. This could be used in middle school social with many different units. It could be used for example to create a timeline of civil war battles.
http://www.forsythcountyschools.org/its/kadkins/timeline.htm
This lesson uses spreadsheets to make a timeline. This could be used in middle school social with many different units. It could be used for example to create a timeline of civil war battles.
http://www.middleschool.net/lesspln/ssFP/SocialStudies/ssSGPh.htm
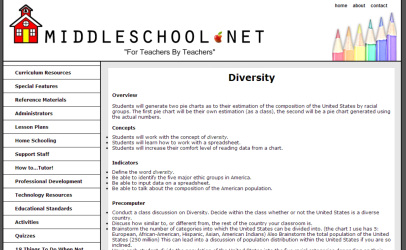
This lesson discusses diversity in the U.S.A. and in the classroom. This blends using a spreadsheet to visualize data as it is perceived and comparing it to factual data. This is a powerful tool to use in this way because it is often perceptions and not necessarily reality that cause conflict. This could be adapted to determine how far from the norm the population of students and staff are from from the national statistical norm. A discussion could ensue as to why the figures differ.
http://eduscapes.com/sessions/ptools/data1.htm
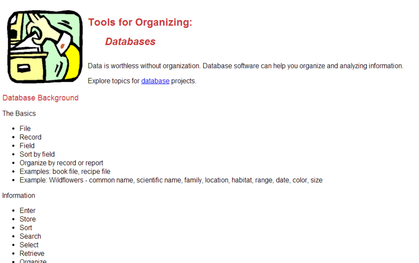
One of the ideas presented on this site was the use of excel to create a database. This could be integrated into middle school social studies rather easily. Students could create a searchable database of U.S. Presidents, their party affiliations, and years in office.
http://mathforum.org/paths/measurement/pophunt.html
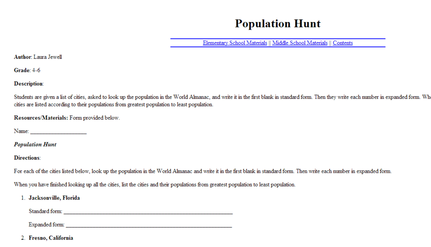
The population hunt involves researching information and compiling a list of figures. This could be adapted to a 21st century middle school social studies classroom by using the data that is gathered to construct a spreadsheet that graphs the data to show the changes over time. Students can then discuss in groups why they think these changes have occurred and share their reasoning with the class in a group discussion.
Week 3 Spreadsheet Assignment - Part 2
Spreadsheet Software Lesson
Cultural Diversity: An examination of data
The Cultural Diversity Lesson will have students create a spreadsheet using data from the US Census Bureau, The Texas Education Agency, and campus surveys. Students will create the spreadsheet using the data and analyze the differences that exist between the United States data, the State of Texas data, and campus data. Students will formulate a hypothesis for why these differences exist in the data and will share these in a class discussion. The instructor will then have the students think about the demographic data of the 17th, 18th, and 19th centuries and identify any similarities that may exist in cultural tensions today that were present then. This will be used to launch a unit on diversity in the 17th, 18th, and 19th centuries.
Lesson Goals
The goal of this lesson is multifaceted. Students will gain a broader understanding of cultural diversity and will begin to understand how different regions of the country and the world will have populations that differ. Students will also have the opportunity to construct charts and graphs using primary source data, interpret the data, and formulate a hypothesis about why the data are different.
Standards to be addressed.
Texas TEKS
§113.20. Social Studies, Grade 8
(29) Social studies skills. The student applies critical-thinking skills to organize and use information acquired through established research methodologies from a variety of valid sources, including electronic technology. The student is expected to:
(A) differentiate between, locate, and use valid primary and secondary sources such as computer software, databases, media and news services, biographies, interviews, and artifacts to acquire information about the United States;
(B) analyze information by sequencing, categorizing, identifying cause-and-effect relationships, comparing, contrasting, finding the main idea, summarizing, making generalizations and predictions, and drawing inferences and conclusions;
(C) organize and interpret information from outlines, reports, databases, and visuals, including graphs, charts, timelines, and maps;
(H) use appropriate mathematical skills to interpret social studies information such as maps and graphs;
(I) create thematic maps, graphs, charts, models, and databases representing various aspects of the United States; and
The above standards can be located at http://ritter.tea.state.tx.us/rules/tac/chapter113/ch113b.html
Spreadsheet Description
The spreadsheet will consist of 12 rows and 9 columns. The spreadsheet is titled “Ethnic Data Comparison Table”. Underneath the title are two headings to help organize the data.These headings are “Ethnicity”(for a column on different ethnicities) and “Population” to help organize the population data. The population data heading are USA, USA %, Texas, Texas %, Campus Student, Campus Student %, Campus Staff, and Campus Staff %. The % columns are there so that students can enter the data from the primary sources as percentages. They will then have to use a formula in Google Spreadsheet to populate the adjoining column to show the actual number of people in that demographic.
